Public views of policing in England and Wales 2015/16
Summary
In 2015, HMIC commissioned Ipsos MORI to undertake a survey of public perceptions of policing in England and Wales. This report sets out the results of this survey. The results have also been summarised in the infographic below.


Click on the image below to see a summary of each topic:


Get the full report
Public views of policing in England and Wales 2015/16
Get the press release
New survey reveals that people are confident in the police
Summary of findings


Around three-quarters of all respondents are satisfied with their area and feel safe after dark.
Those living in more deprived neighbourhoods were more likely to say that they felt unsafe and that crime/anti-social behaviour was a big problem locally.
Demographic groups more likely to live in these areas, for example younger people and people from black and ethnic minority groups are also disproportionately more likely to feel unsafe and think that crime or anti-social behaviour is a problem.

Overall 26 percent of respondents felt unsafe:
- 24 percent feel very safe;
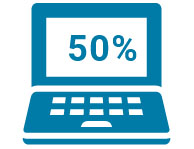
- 50 percent feel fairly safe;
- 21 percent feel a bit unsafe; and
- 5 percent feel very unsafe.

Different age groups have different opinions about their feelings of safety.
- 33 percent of 16-24 year olds felt unsafe, compared to 21 percent of 65+ year olds;
- 31 percent of people from black or minority backgrounds also felt unsafe.

Three times more people were satisfied than dissatisfied with local policing (52 percent satisfied; 17 percent dissatisfied).

When asked about changes in local police services 65 percent of people did not feel levels of services have changed over the past year.
18 percent of people felt that the level of service had got worse over the last year.

31 percent of people had contact with local police in the last year.
- 17 percent as a victim or witness to a crime; and
- 3 percent as a result of an arrest or a stop and search.
Those respondents living in more deprived areas, younger people and people from black and ethnic minority backgrounds were more likely to have had contact with the police.

The extent to which someone interacted with local police officers/PCSOs was a powerful predictor of how they spoke about the police; the more frequent the contact the more positive the views expressed were.
Respondents drew heavily on personal experience when commenting on the police; just over half agreed they were treated fairly and with respect.
Value for money
Most people did not hold strong views about the value for money that their local police provide.
Half of people surveyed did not know enough to say whether their local force’s budget increased or decreased over the past year.

Those who said that they have been consulted about local crime and anti-social behaviour were significantly more likely to feel that the police understood relevant local issues and were dealing with them.
Seeing a uniformed police presence is important to people. More people were dissatisfied than satisfied with levels of uniformed policing in their areas. They were over four times more likely to say they have seen a decrease than an increase in numbers of officers and PCSOs over the past year.
Those who were satisfied with police presence expressed a greater confidence in being able to access services in both emergency and non-emergency situations.
Interest

Six out of ten people have not done anything in the past year to find out about local policing.
- 7 percent of people said that they received a police newsletter; and
- 3 percent of people have attended a local police meeting.

76 percent of people said that they are interested in finding out more about local policing.
Contact
 Over twice as many people did not feel well informed about local policing than did feel informed (64 percent feel uninformed; 31 percent feel informed).
Satisfaction

62 percent of those who had a contact with the police were satisfied with the services that they received.
Respondents were more likely to be satisfied if they had been told what to expect and felt that this was then what happened.

The large majority of people said that they were aware of cyber-crime but knew little about it and were unaware of any local police work to deal with it.

Less than 0.5 percent of people had been a victim or witness to cyber-crime.
Of the small number that had, only half reported it to the police.

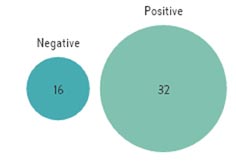
Overall, people were twice as likely to speak positively about their local police than to express negative views.
Get the full report
Public views of policing in England and Wales 2015/16 (PDF document)